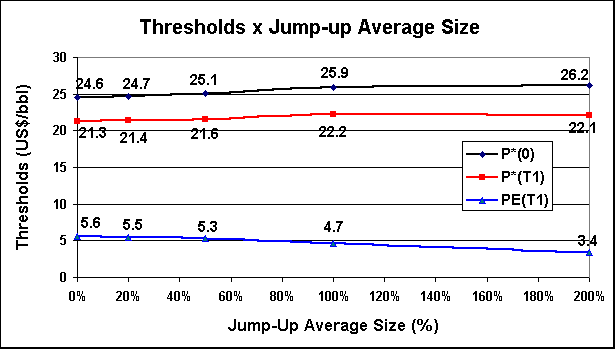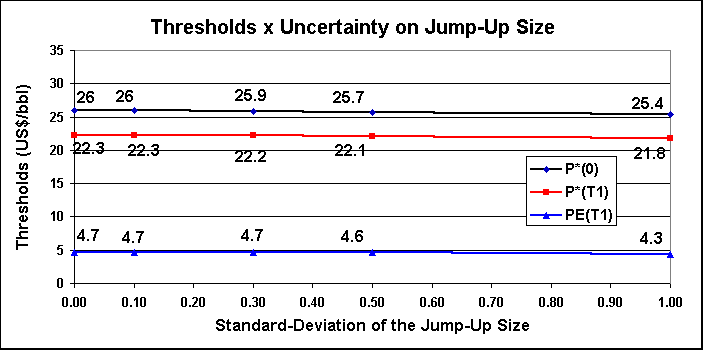
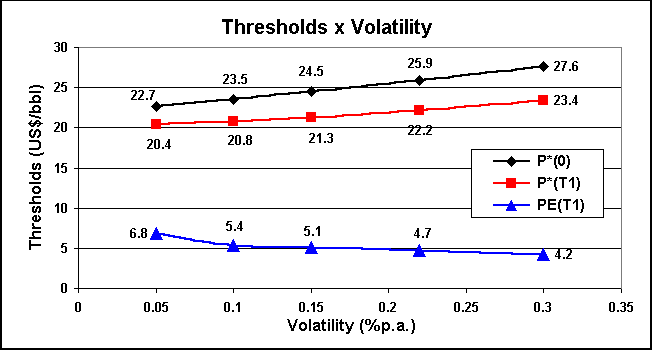
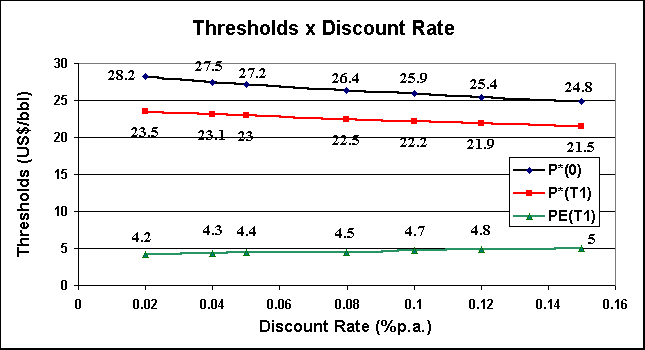
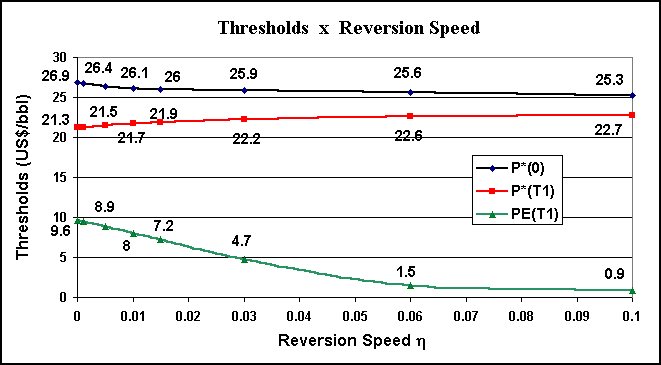
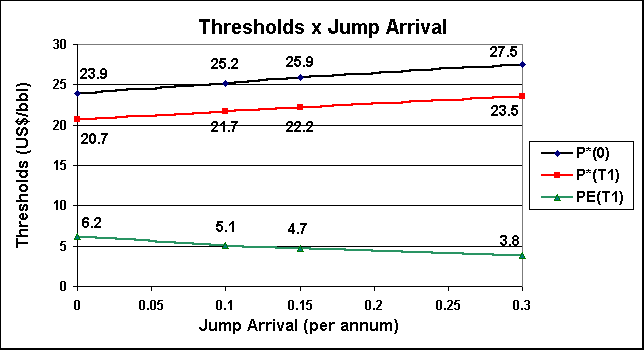
The following graphs show the sensitivity analysis of the base case of extendible option using the jump-reversion model. For an overview of stochastic process including jump-diffusion models like our, go to the Stochastic Process Webpage
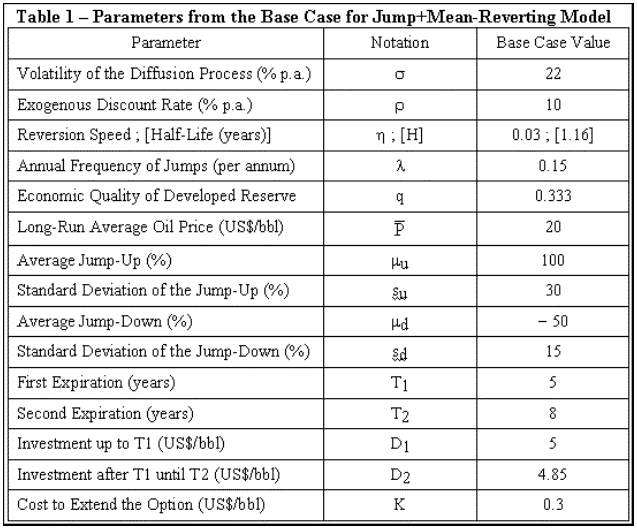
First is presented the base case values for the parameters, as well as the notation used:

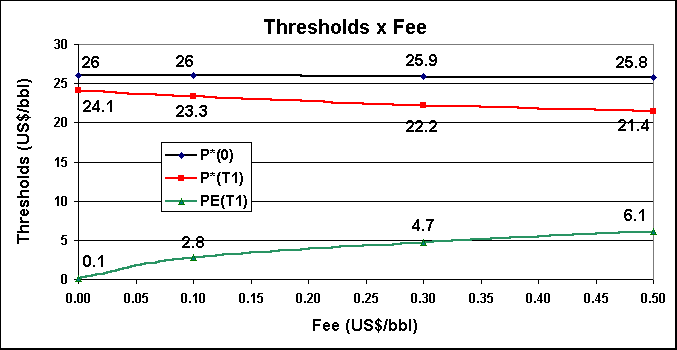
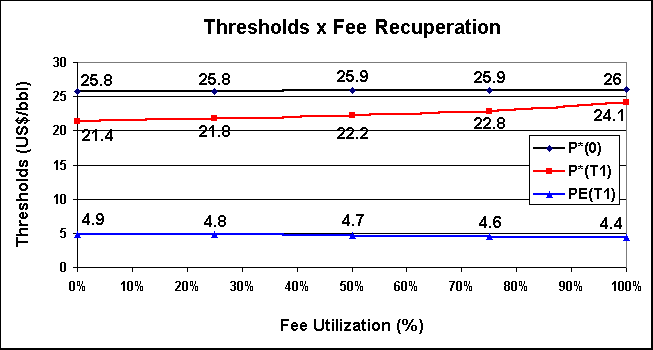
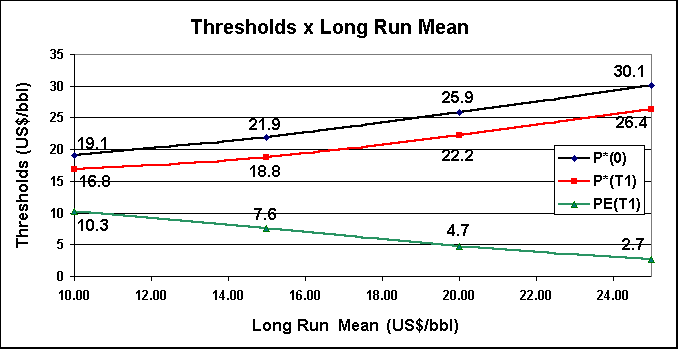
Now several sensitivity analysis:
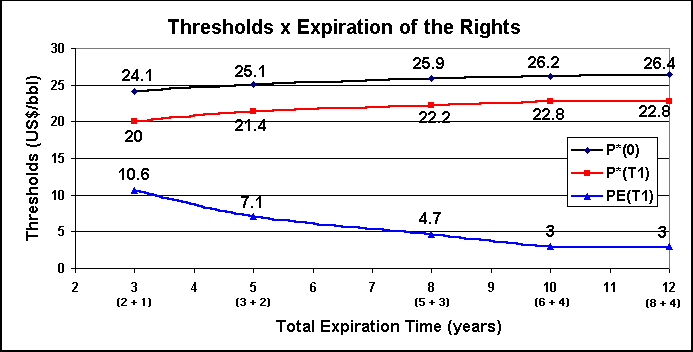
The next figure shows the sensitivity of the thresholds with the total time to expiration.
In reality, only for the threshold at t = 0 the total time to expiration matters.
For the threshold at t = T1 and for the extendible threshold (PE), only the second expiration matters
because the first period is past.
This is also displayed in the picture below, see that for total time of 10 years and 12 years, both
has 4 years in the second period (see in the X-axis scale the break of the total expiration time) and
the T1 thresholds values don't change.
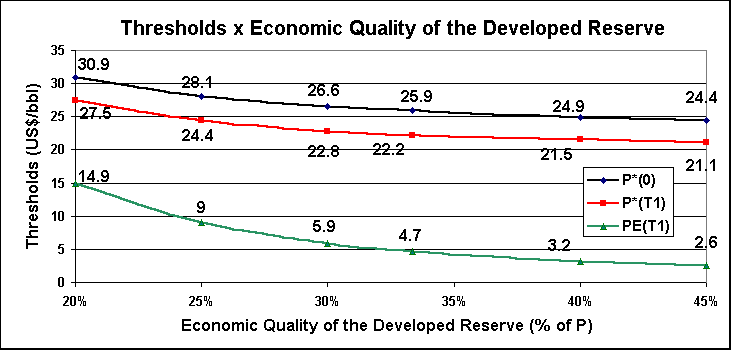
The chart below presents the sensitivity of the thresholds with the economic quality of a
developed reserve (q).
In this analysis, the NPV of the underlying asset changes with q. So, the chart reflect large changes
in the underlying asset value (NPV/barrel = qP - D).
